This page explores the relationship between team payrolls and on-field success in Major League Baseball's American League and allows users to compare payroll, wins, losses, and win percentage to see whether money actually translates into performance.
| Team | W | L | W-L% | Payroll |
|---|---|---|---|---|
| Blue Jays | 74 | 88 | 0.457 | $349,341,872 |
| Yankees | 94 | 68 | 0.580 | $413,168,749 |
| Red Sox | 81 | 81 | 0.500 | $277,149,772 |
| Rays | 80 | 82 | 0.494 | $111,236,666 |
| Orioles | 91 | 71 | 0.562 | $198,658,666 |
| Guardians | 92 | 69 | 0.562 | $119,347,768 |
| Tigers | 86 | 76 | 0.531 | $203,286,249 |
| Royals | 86 | 76 | 0.531 | $192,105,858 |
| Twins | 82 | 80 | 0.506 | $140,569,380 |
| White Sox | 41 | 121 | 0.253 | $132,406,666 |
| Mariners | 85 | 77 | 0.525 | $200,030,333 |
| Astros | 88 | 73 | 0.547 | $250,892,491 |
| Rangers | 78 | 84 | 0.481 | $218,531,666 |
| Athletics | 69 | 93 | 0.426 | $152,707,856 |
| Angels | 63 | 99 | 0.389 | $205,587,689 |
Comparison of American League MLB team payrolls and win percentages for the 2024 season.
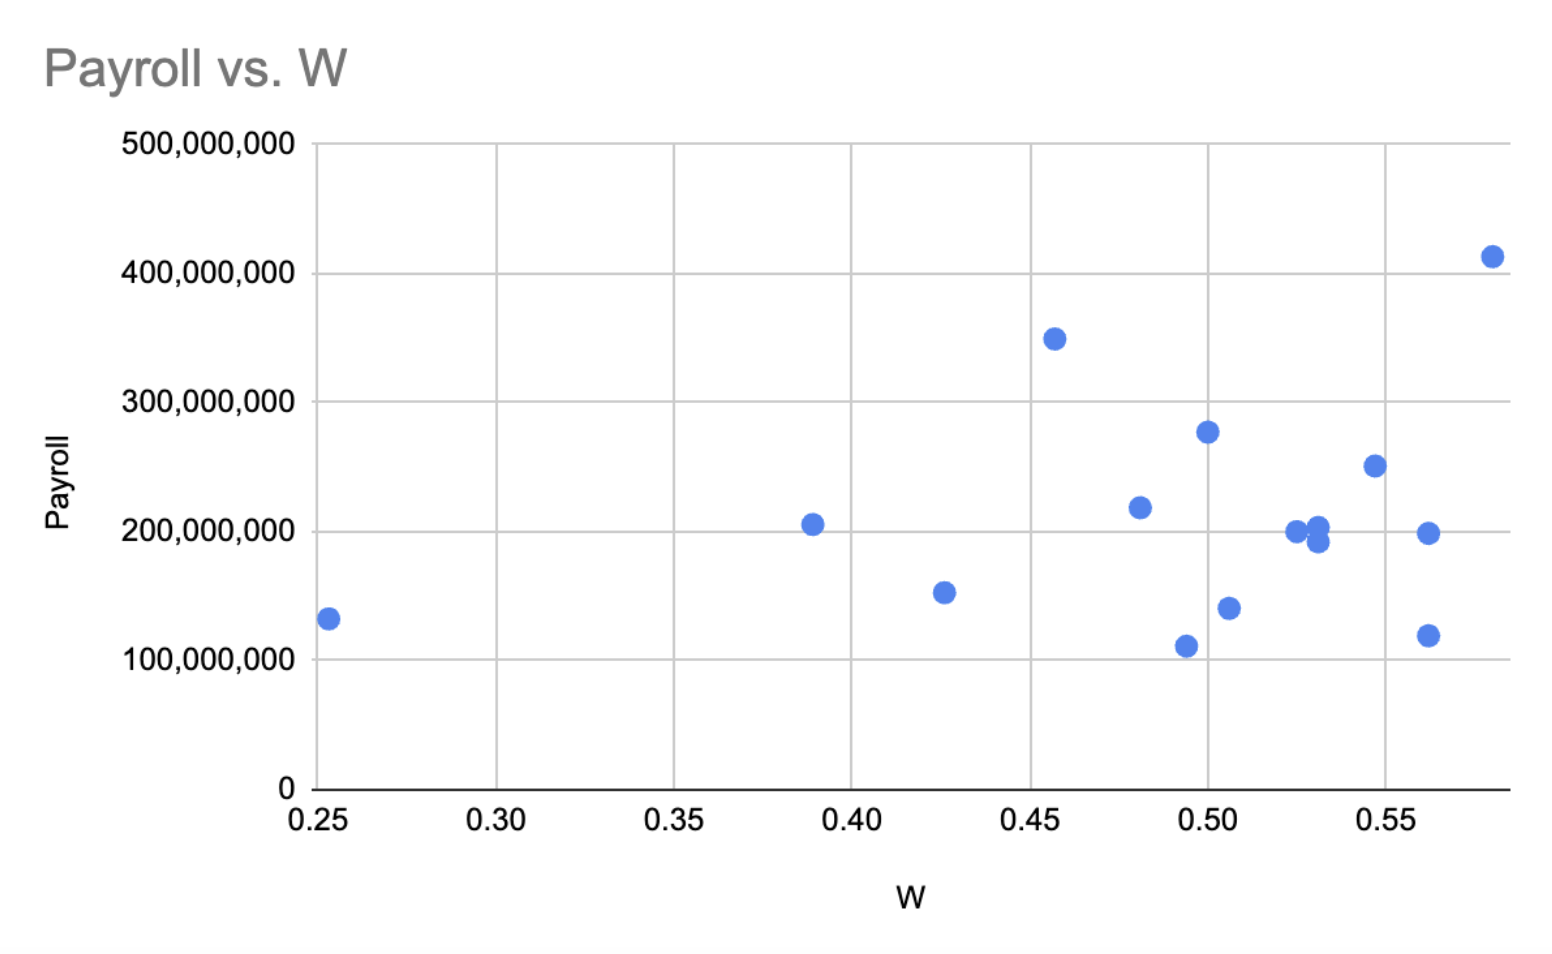
Scatter plot — each dot is one AL team. X-axis = payroll in millions, Y-axis = total wins.
If higher spending guaranteed more wins, this scatter plot would show a clear upward diagonal line. It does not. The Blue Jays spent $349M — second most in the league — yet won only 74 games and finished below .500. Meanwhile, the Guardians won 92 games on just $119M. The scatter plot is the right chart here because it makes the absence of a clean relationship the visual argument itself.
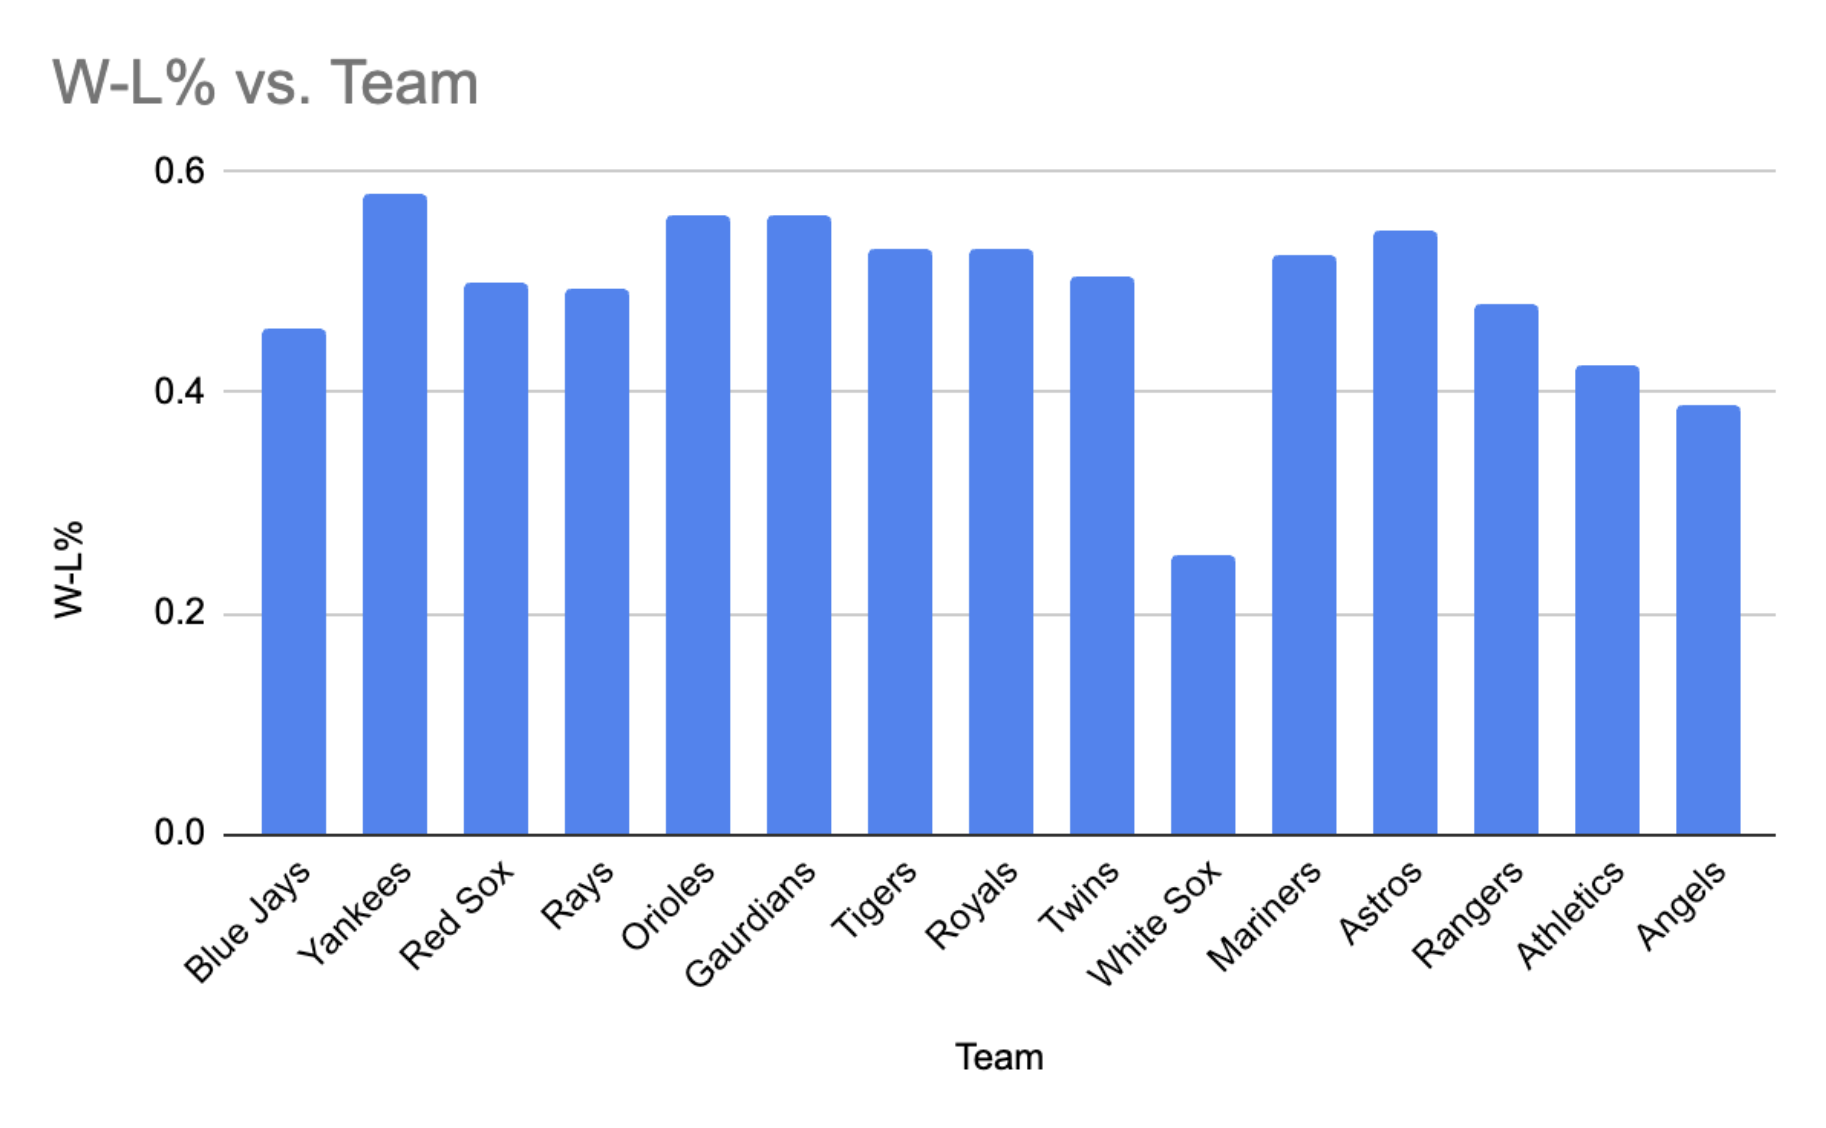
Bar chart — win percentage for all 15 AL teams, grouped by division.
Grouping teams by division reveals where talent was concentrated in 2024. The AL Central stood out as the most competitive division, with four teams finishing above .500. The AL East showed the widest range — the Yankees and Orioles at the top, and the White Sox posting a historically bad .253 win percentage despite a $132M payroll. The bar chart makes these division-wide patterns easy to compare at a glance.
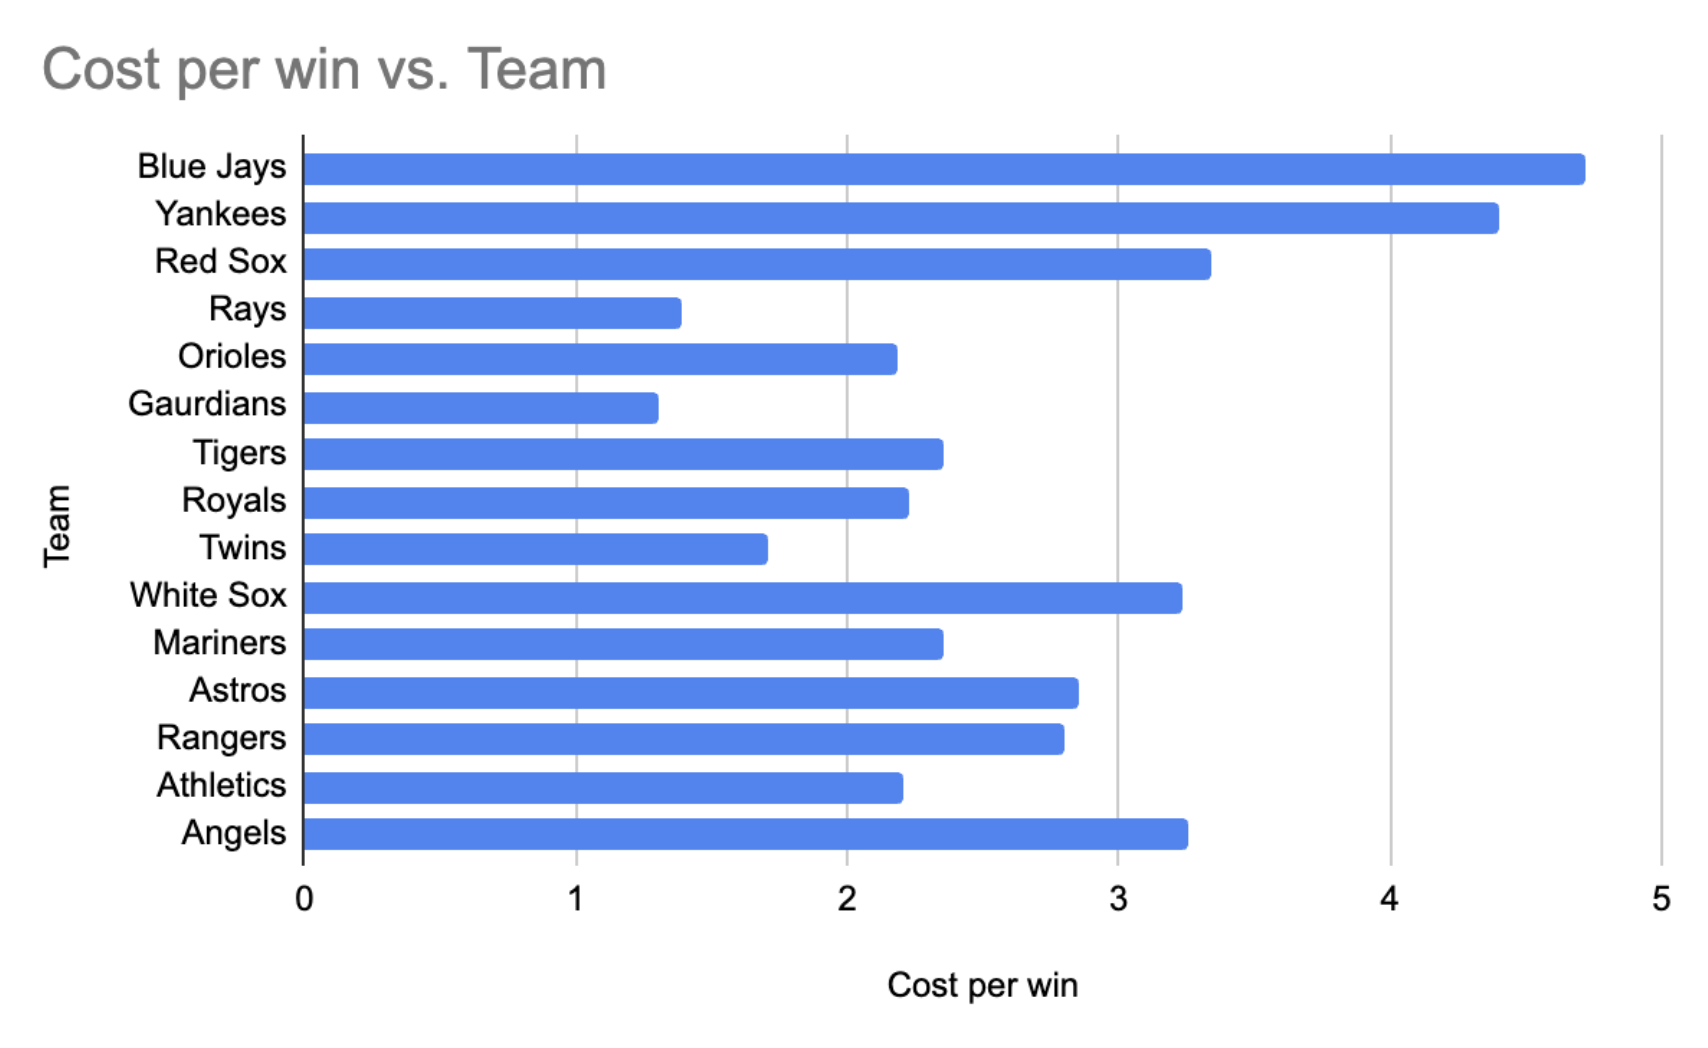
Horizontal bar chart — each team ranked by cost per win (payroll ÷ wins). Lower = more efficient.
Dividing each team's payroll by their win total reveals who spends most efficiently. The Guardians come out on top at roughly $1.30M per win. The Blue Jays rank last at nearly $4.72M per win — almost four times the cost for the same result. This chart makes the strongest argument of the three: smart roster-building matters more than a big budget. Teams like the Rays and Guardians consistently outperform their payrolls through player development rather than free-agent spending.
| Team | Payroll ($) | Wins |
|---|---|---|
| Yankees | 413,168,749 | 94 |
| Blue Jays | 349,341,872 | 74 |
| Astros | 250,892,491 | 88 |
These teams represent the highest payrolls in the American League. While the Yankees lead the league in spending and wins, the Blue Jays spend nearly as much but finish with a losing record. This suggests that increased payroll does not always result in proportional on-field success.
Data Sources:
Wins and losses data from Baseball Reference
Payroll data from Spotrac
Image Credit:
MLB logo from Wikipedia